
The Daily Market Forecast

Friday’s Results: The suggested buy at 4108.00 caught the low of the session and ran for 43 points. The high of the market was another volume level (unpublished here).
Quick Tip: Volume Leads Price
For as complex and chaotic as the markets are, technical traders only have 3 variables to analyze. Price, volume, and time. Most technical traders agree that volume LEADS price.
Price moving up with volume increasing is very bullish. It’s hard evidence that plenty of buying interest is happening. Conversely, price moving up with decreasing volume is not as bullish.
Price moving down with volume increasing is very bearish. More hard evidence. Conversely, price moving down with decreasing volume is not as bearish.
How do you use this data? Entries AND exits!
If you’re a breakout trader and volume is surging at your entry that’s good news. If you’re a reversal trader and volume is decreasing at your entry that’s good news. Confluence.
Similarly, if you’re in a position and volume is...
The Daily Market Forecast
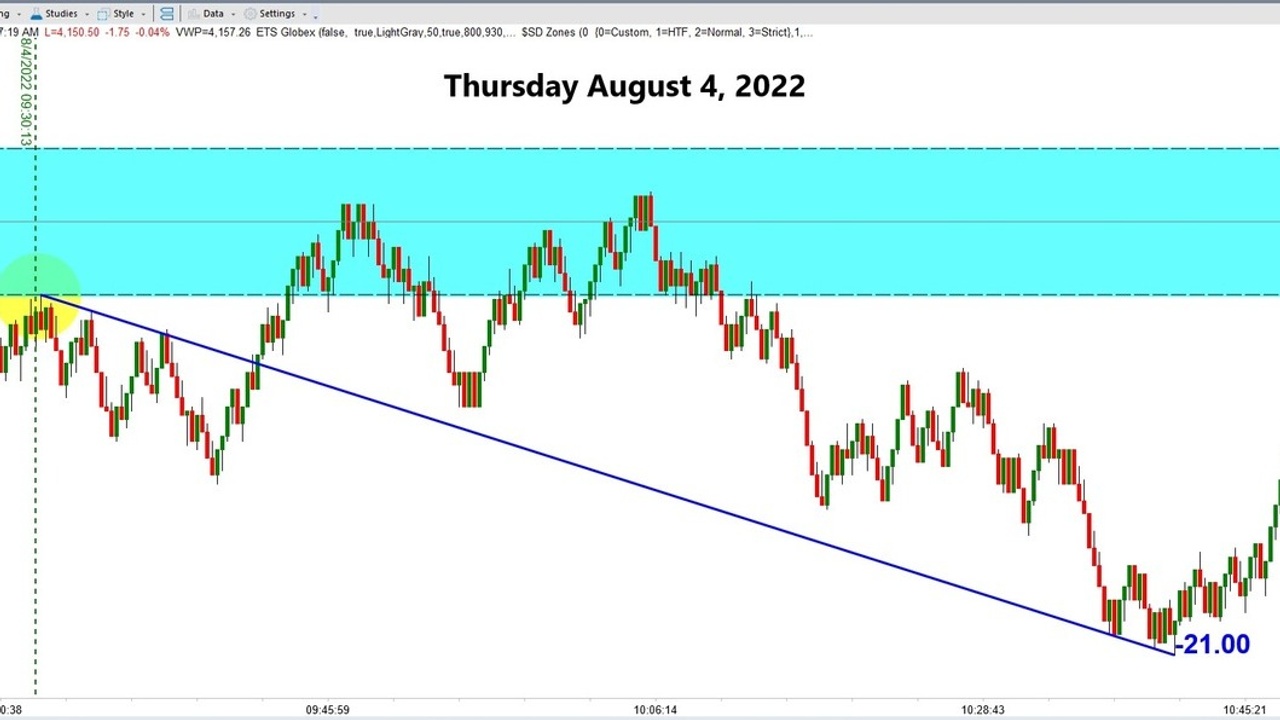
Wednesday’s Results: The suggested breakout short at 4157.00 offered a solid 21-point run.
Quick Tip: Barbell
You certainly have a risk management section built into your trade plan. Without it you’ll fail at trading sooner or later. Many traders think their chosen stop loss order is their risk management plan. Not enough. Here’s a list of all the risks you need to cover in your plan:
1. Trade
2. Psychological
3. Market
4. Liquidity
5. Strategy
6. Brokerage
This game is looking riskier suddenly. How do you balance concern over all the risks with a focus on a positive expectation?
Top notch traders have what is called a “barbell” personality. They are optimistic about the future and confident their strategies will prevail. But they are paranoid about what will prevent that from happening.
Our goals are shiny and desirable. But we know the path won’t be smooth as glass. Do some thinking about what could stop your success. Planning for it will make it easier to digest and s...
The Daily Market Forecast
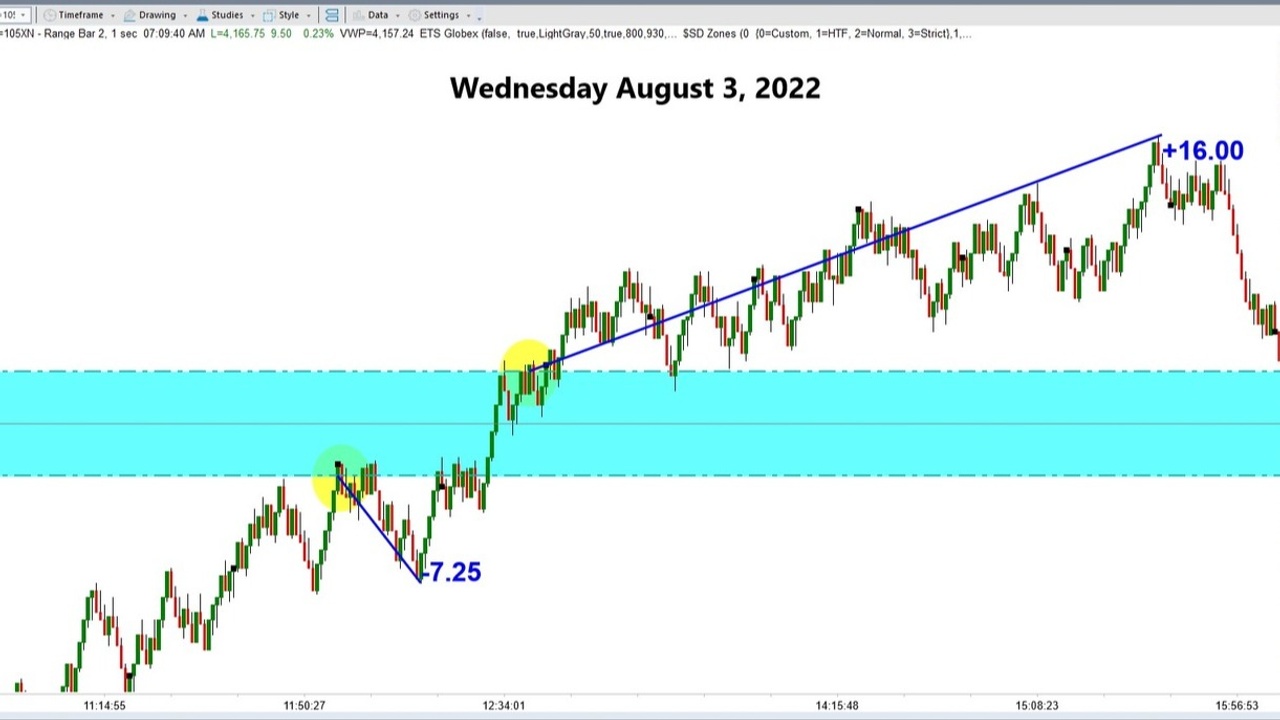
Wednesday’s Results: The suggested short at 4147.00 offered a small 7.25-point run.
Quick Tip: Plan Ahead
Plenty of time trading is spent waiting. You can use that time to plan.
The reversal in the chart above was highly anticipated because it had a confluence of reasons to enter short. A 7-point run is not much, but you could have taken a target or two and stopped out the remainder at breakeven (which is one of our exit strategies). Small winner.
The breakout to join the trend was a better trade, but you should know in advance whether you’re taking the setup (if it occurs).
It’s more comfortable and effective to be proactive with trade choices rather than reactive.
Today’s Best S&P Turning Points (in fast moving markets consider a wider stop and less size):
Sell 4157.00 stop 4162.75 if price drops below and retraces back.
Buy 4108.00 stop 4202.25
Trade Fearlessly,
Mike Siewruk
P.S. What’s more important in trading? Math or emotions? Learn how to change your unwanted...
The Daily Market Forecast
Tuesday’s Results: The suggested short at 4118.50 stopped out.
Quick Tip: Why Review
Years ago, I was urged to get in the habit of daily review and documentation. All the trades my strategies teed up, not just the trades I took. It has paid off big time. The database I mine for edge now is over 12,000 trade setups taken in all market conditions. It’s easy to pick a date range where certain market conditions prevailed and analyze it.
Take the trade mentioned above that stopped out. That was a reversal trade that triggered at 10:52 ET. Historical evidence shows that reversals at that time are poor performers. Filter them out.
When you start using filters based on evidence, your attention may focus on the trades you filtered out that were nice winners. You’ll likely double guess the filter. Keep in mind the sample size your filter emerged from. Don’t get mislead by occasional events. Re-focus on all the losers you didn’t take!
Today’s Best S&P Turning Points (in fast moving market...
The Daily Market Forecast
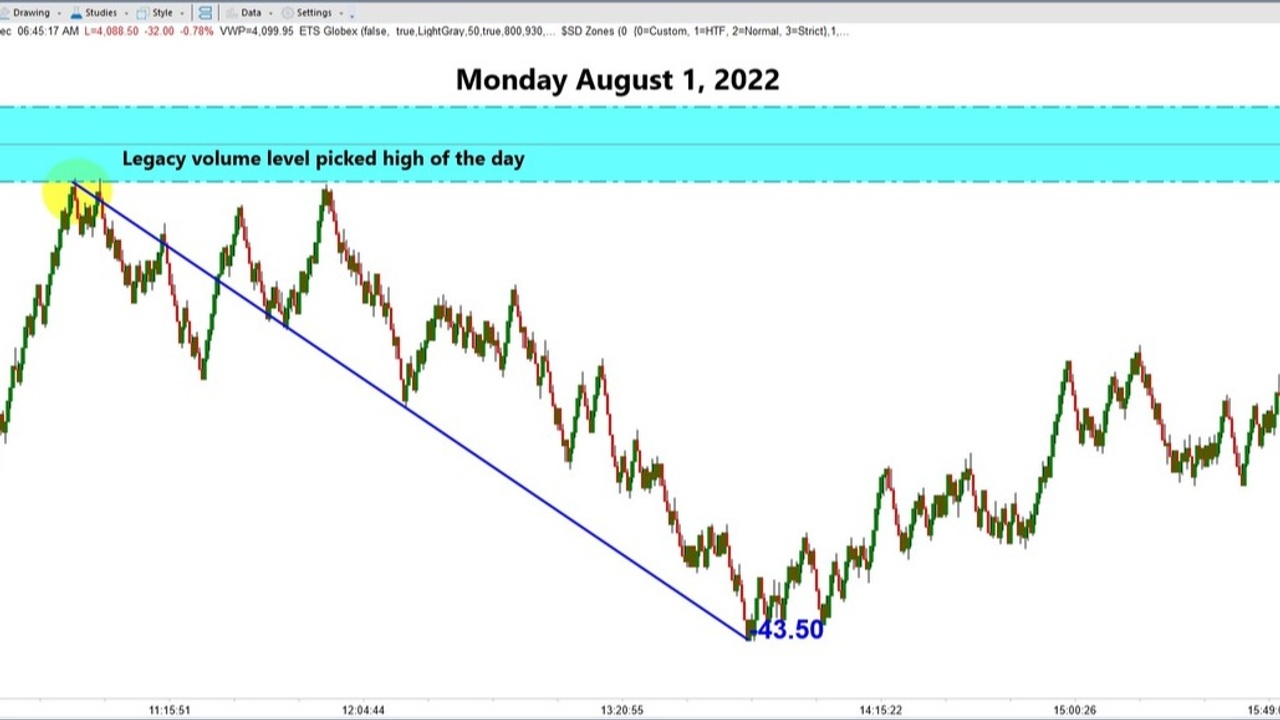
Monday’s Results: The suggested short @ 4147.00 caught the high of the day, only had one tick adverse move, and ran for 40+ points.
Quick Tip: Never Wrong?
Yup. There are people that are never wrong. It’s easy to accomplish if that’s your goal. Just never make decisions. You can’t be wrong if you don’t decide.
Successful people, great traders, they all know that one important quality is decisiveness. They also know that they’ll be wrong much of the time. But that’s OK. They also know how to change course and overcome barriers and roadblocks.
Looking at yesterday’s short trade (see chart) you’ll notice that price was approaching the turning point FAST. This seems like the wrong timing to pick a reversal. Historical evidence suggests otherwise. It turns, for this strategy at least, the slow entries tend to keep moving in the same direction. The parabolic moves flame out.
Knowing that it was an easy decision to enter that trade. Besides, if it stopped out, the other side of th...
The Daily Market Forecast
Friday's results: No trades triggered.
Quick Tip: Focus on This
Novice traders focus on how much they are winning and losing. Every entry, hoping for a winner. Every stopped exit, wishing it didn’t happen. This is incredibly destructive behavior. You’re teasing your emotions, begging them to overrule your common sense.
Here’s how to stop:
1. Get a rule-based trade plan.
2. Document every trade opportunity including the trades you didn’t take.
3. Create a rich database of evidence with hundreds of trades, maybe thousands.
4. Calculate the win/loss percentage of your strategy.
5. Calculate the average winning and losing trade in dollars.
6. Calculate the net gain and divide by the total number of trades.
Now you know the amount of money you make every time you click to enter regardless of outcome. That is what your mind should be focused on when a trade setup triggers. Not winning or losing. But knowing with statistical relevance that over the long haul your strategy earn...
The Daily Market Forecast
Thursday’s Results: No trades triggered.
Quick Tip: Being Adaptable
One trait of successful traders is being adaptable to changing conditions. It’s a golden quality but not an easy one to master. The reason is that like many things, adaptability is not a black or white issue. There are all those shades of gray!
Think about your view on the market. Are you Bullish or Bearish? My answer would be “In what timeframe?” The last few days have turned me Bullish in the near term, but my view months out is still Bearish.
Being right or wrong is not the issue. We need to decide for trade direction’s sake where the momentum is leading us and trade with that edge, in the appropriate timeframe. Being adaptable will help.
Today’s Best S&P Turning Points (in fast moving markets consider a wider stop and less size):
Sell 4147.00 stop 4152.75.
Buy 4076.00 stop 4070.25.
Trade Fearlessly,
Mike Siewruk
The Daily Market Forecast
Wednesday’s Results: The suggested short @ 3994.50 offered 8.25 points, but you shouldn’t have taken it.
Quick Tip: Filters
Your trading approach and basic strategy rules should have a positive expectation. We call it “edge.” Like a casino, you’ll lose plenty of trades but in the end you have a profit.
Here’s the power in review and documentation. Once you’ve captured all kinds of data about your trades you can look for filters.
The obvious filter yesterday was the FOMC announcement. You didn’t need review and documentation for that one. When the market gets too volatile you simply back off and wait for it to settle down.
Other common filters are time of day, day of week, even day of month. Try some technical indicators, too. You’ll find benefit with RSI, Bollinger Bands, ATR, and others.
Keep in mind, these are NOT predictive. They are lagging. But in some cases they ADD confluence to your trade setups and by using them as a filter you can fine tune your trading results.
...The Daily Market Forecast
Monday’s Results: Price chopped sideways in a very narrow range for recent volatility. The suggested buy @ 3962.75 stopped out.
Quick Tip: Time to Change?
All traders experience losing streaks and drawdowns in their trading account. Market conditions change. Some strategies stop working and others start working. It’s all very cyclical.
Handling this is tricky. One voice in your head says, “stay the course, it’ll come back.” The other voice says, “dump this strategy and find one that is working.”
But it doesn’t have to be a black or white decision. You can reduce your position size to the bare minimum or trade in simulation. Examining your equity curve for clues on how much prior down cycles lasted might help.
The BEST solution is not reactive, though. It’s proactive. Design your trade plan with multiple strategies. Even if you’re not trading them all at once, monitor their performance as if you were actively trading them. Keep detailed records. If you’re struggling with your pri...
The Daily Market Forecast
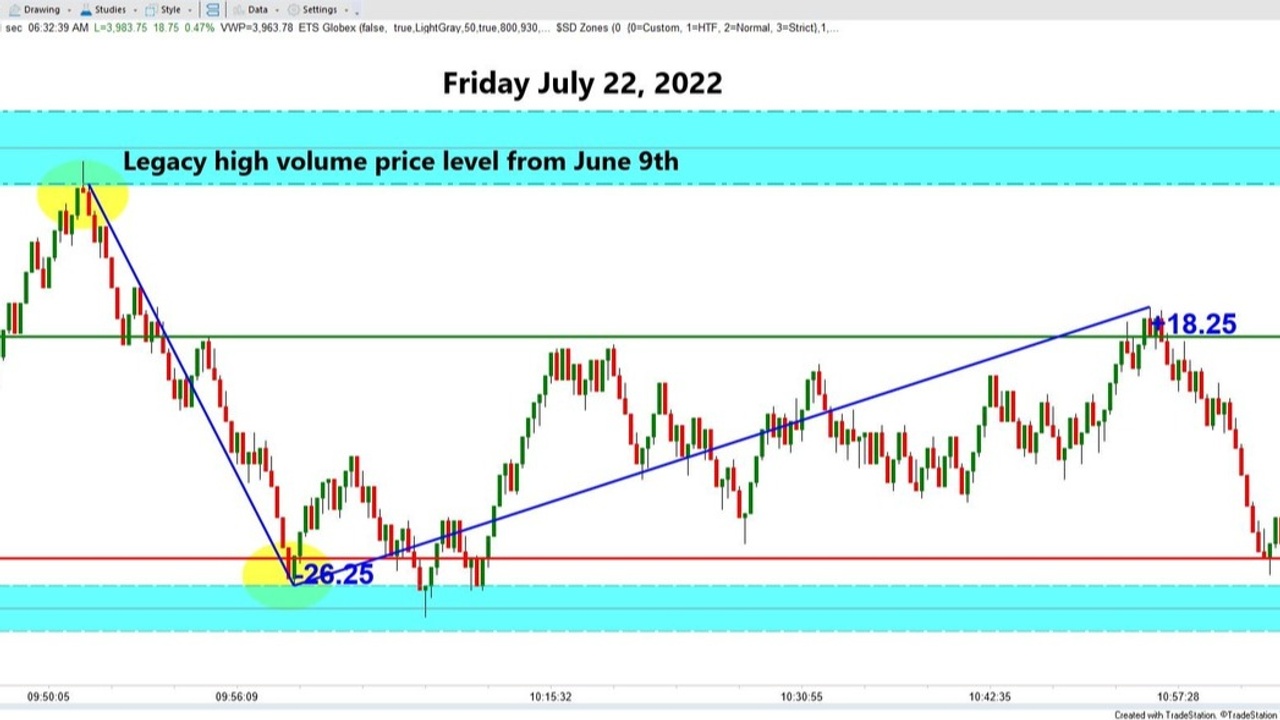
Friday’s Results: The suggested short picked the top of the market and ran for 26.25 points to the next volume level.
Quick Tip: Trust or Fear?
Friday was a brilliant day for our Volume Profile strategy. Four solid winners, one small loser. Looking at the chart above, price was fast approaching our suggested short level, which originated on June 9th. Would you trust it or be fearful?
Ten minutes later, where we have our final profit target, the plan says… go long! Would you trust your plan or be fearful of losing some of that awesome gain?
To trust your plan, you need to have a complete, personalized, and evidence-based plan (8 major components). It should be in harmony with a broader trading philosophy.
If you want to learn more, our FREE “Ultimate Personalized Trade Plan” class has been updated with PAIDtm methodology (Plan/Abundance/Investigate/
T...