
The Daily Market Forecast... FOMC Evidence
Tuesday’s Results: The buy at 3713.75 caught the bottom of the day running 39.75 points before closing the session +26.25.
Quick Tip: FOMC Evidence: S&P
Everyone knows the pattern on FOMC day tends to be range-bound before the announcement and spiky afterward. This should help your trade selection and planning. In fact, if you have solid historical data on your strategy’s performance on FOMC day you might not trade at all. It’s always better to have some probabilities at hand. Keep accurate records whether you took the trades or not.
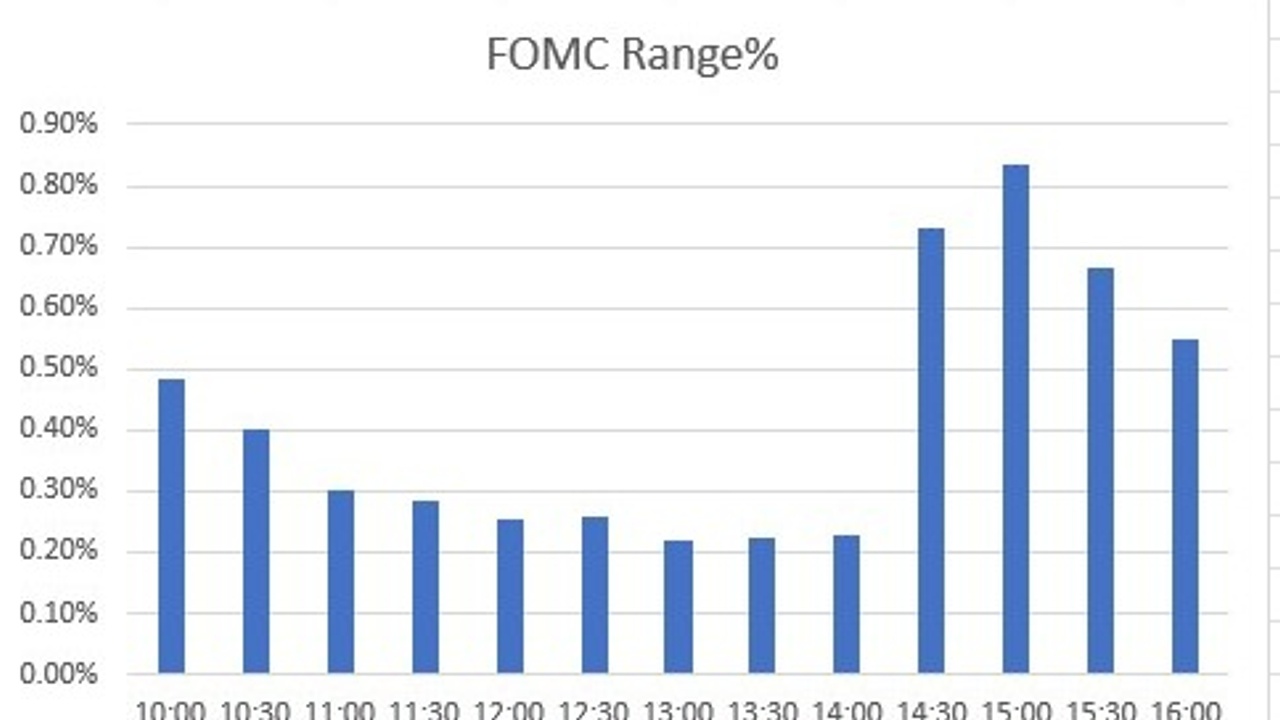
The announcement releases at 2PM ET. You might think the highest volatility is within the 30-minute interval afterward. Historically, it’s the next 30-minute interval (see second chart).
Direction and move for both intervals: 64% UP, 36% DOWN.
The move widens consistently during the second interval: +29 to +33 points and -17 to -24 points.
Are there any actionable rules you can apply? Maybe so, maybe not. But it’s worth analyzing your strategy’s prior performance during these times.
Today’s Best S&P Turning Points: Evidence suggests holding off on volume reversal levels after the announcement today.
Trade Fearlessly,
Mike Siewruk
Join me on Sunday, June 19 @ 5PM ET for my new FREE mini-class “Day Trading for Day Workers.” Click here to register.