
The Daily Market Forecast... Time to Sell?
Today’s Lesson: Overbought is tricky.
Price soars way up, it’s overbought. Price plunges way down, it’s oversold. There are many indicators and chart patterns for verifying these conditions. The rub is these conditions can persist. Exiting too soon isn’t all that bad. All you did was make a little less profit. Entering the reversal too soon is usually trouble.
Our stock market, all indexes, are at all-time highs. The charts show parabolic moves up. The economic landscape is questionable. Gravity will prevail one day.
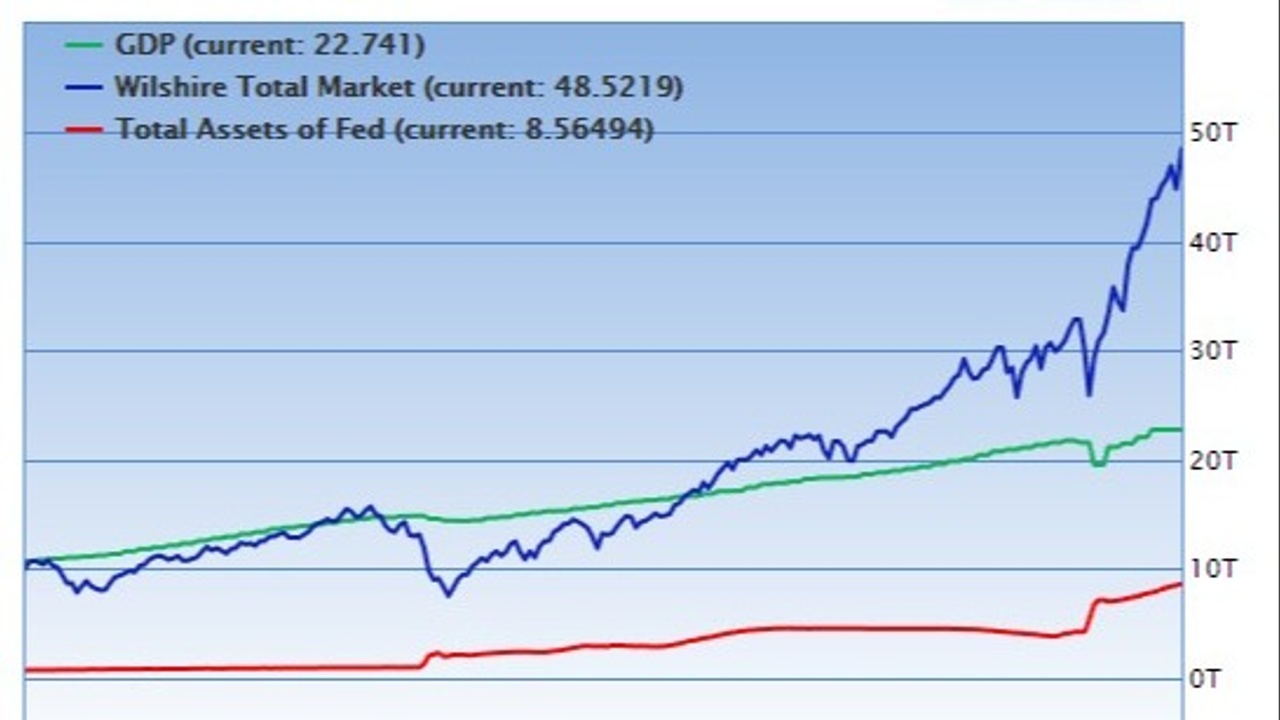
Short term traders love this price action. Jump on the trends, fade the ranges. Lots of opportunities. Long term investors are likely excited (about mounting gains) and worried (about the ultimate outcome). One good proxy for the valuation of the markets and likely future direction is the Buffett Indicator (see chart above).
Warren said the percentage of total market cap (TMC) relative to the US GNP is “probably the best single measure of where valuations stand at any given moment.” Gross Domestic Product (GDP) is the total monetary or market value of all the finished goods and services produced within a country's borders in a specific time period. We’re trading at 214% of GDP now. That means the stock market is worth more than TWICE the value of the U.S. economy.
Of course, if you look at the chart carefully you’ll see that this “overbought” condition can and does PERSIST. There is no magical answer here. You just need to be aware and decisive on a daily basis. Bubbles burst and prices fall faster than they rise (historically about 3X as fast). The worst thinking would be complacency.
Trade Well,
Mike Siewruk
P.S. For a free “mini-course” packed full of lessons on HOW to trade the Blog… Watch this video.