
The Daily Market Forecast... volume redefined
Thursday’s Blog Results: Your suggested entries didn’t trigger. The profile was wide open due to the rapid drop after the FOMC announcement.
Today’s Trading Tip: Volume redefined.
In technical trading there are only a few variables to consider: price, volume, and time. Every technical indicator or method is derived from variations of these variables.
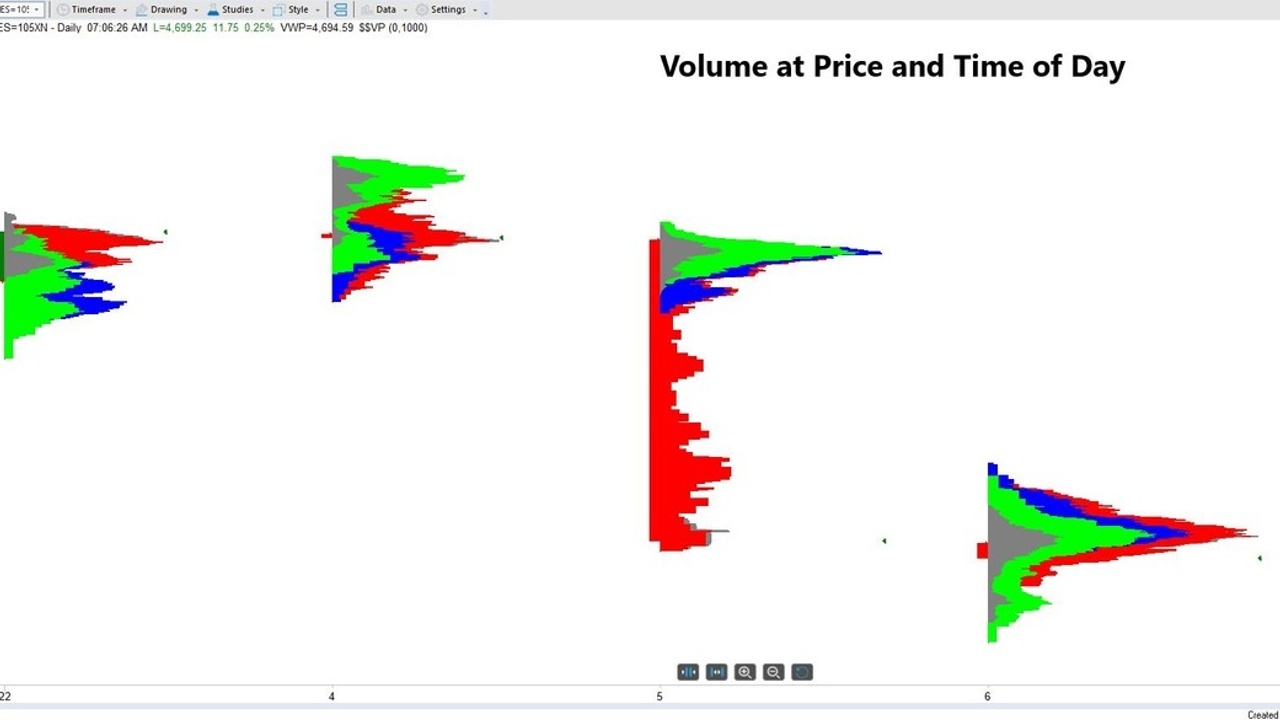
Most traders look at volume within a time interval. They see volume in a histogram at the bottom of the chart. Good to know.
The chart above flips the volume from the time axis to the price axis. Now you see the volume at specific prices. Much better to know.
Why? Large traders (institutions) approach buying and selling different than you and I. When we want to buy or sell we click a mouse and it’s done. Our position size is small.
Large traders can’t do that. They need to accumulate and distribute their positions in their chosen price ranges.
Let’s say you consume 8 bottles of mineral water a day. The local grocer puts your brand on sale every Tuesday. You save plenty by making sure you’re buying on Tuesday. You probably stock up and buy more than you need just because the price is right. You accumulate your water, rather than buying 8 bottles every day.
Why would you NOT want to know where the value price is in the eyes of the traders moving the market? If you want to see how trading volume at price works in a live trading session, click here.
Today’s Best S&P Futures Turning Points (same as yesterday):
Short Level: Sell 4777.00 stop 4781.75.
Long Level: Buy 4644.75 stop 4639.75.
Happy New Year!
Mike Siewruk
P.S. Tired of trading alone? Need more quality setups? Learn how our team-based approach can accelerate your trading performance. Click here for FREE video training.