
The Daily Market Forecast... Hat Trick
New feature: Daily S&P turning points
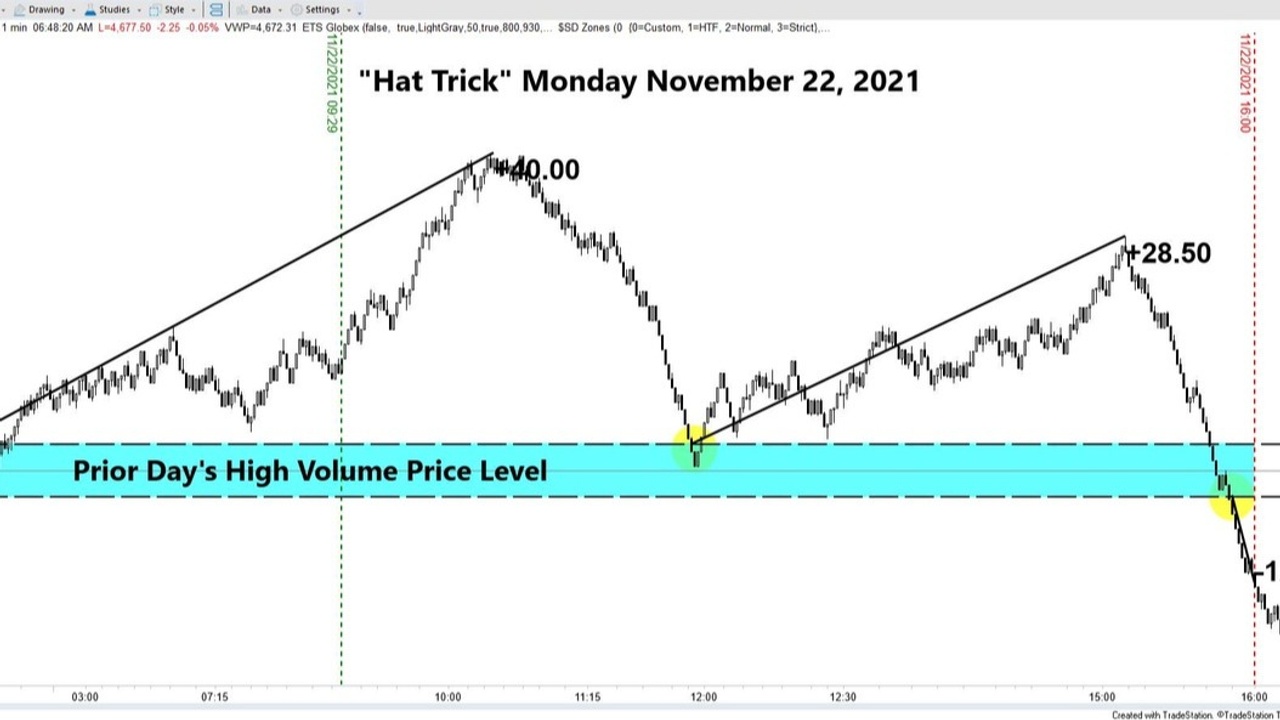
Monday’s Results: The suggested long 4700.50 was good for up to 28.50 points during the day session (after soaring 40 points in the Globex). The suggested short on the breakout below 4693.25 was good for 12 points at the close... 6 minutes later.
Today’s Lesson: Range, Tick & Volume charts.
Time-based candles are used most often and are sufficient for swing and position trading. When day trading, you can benefit from monitoring multiple chart types… range, tick and volume bars. Why? They frequently display a different “picture” of what price is doing. This information that is “hidden” in a time-based chart can be very helpful for honing your entries and exits.
The suggested short yesterday required price to trade below 4793.25 and then retrace back to that price for the short entry. The chart above is a 2-point range chart, meaning price paints a new candle after 2 points of movement. It’s more granular than a time-based chart. The dip below and back to the entry price happened fast and might not have been noticed in a time-based chart. Tick charts are excellent as well. Mix it up!
Today’s Best S&P Futures Turning Points:
Short Level: Sell 4708 stop 4713.75 (5.75 risk).
Long Level: Buy 4650.75 stop 4646.25 (4.50 risk). Trade Well,
Mike Siewruk
P.S. Join us every Saturday morning @ 10:00 ET for our weekly LookBack (5) trade review session. Every trade for the week is analyzed. Now open to the public. Meet the team. Ask questions. Register here for the December 4th session.