
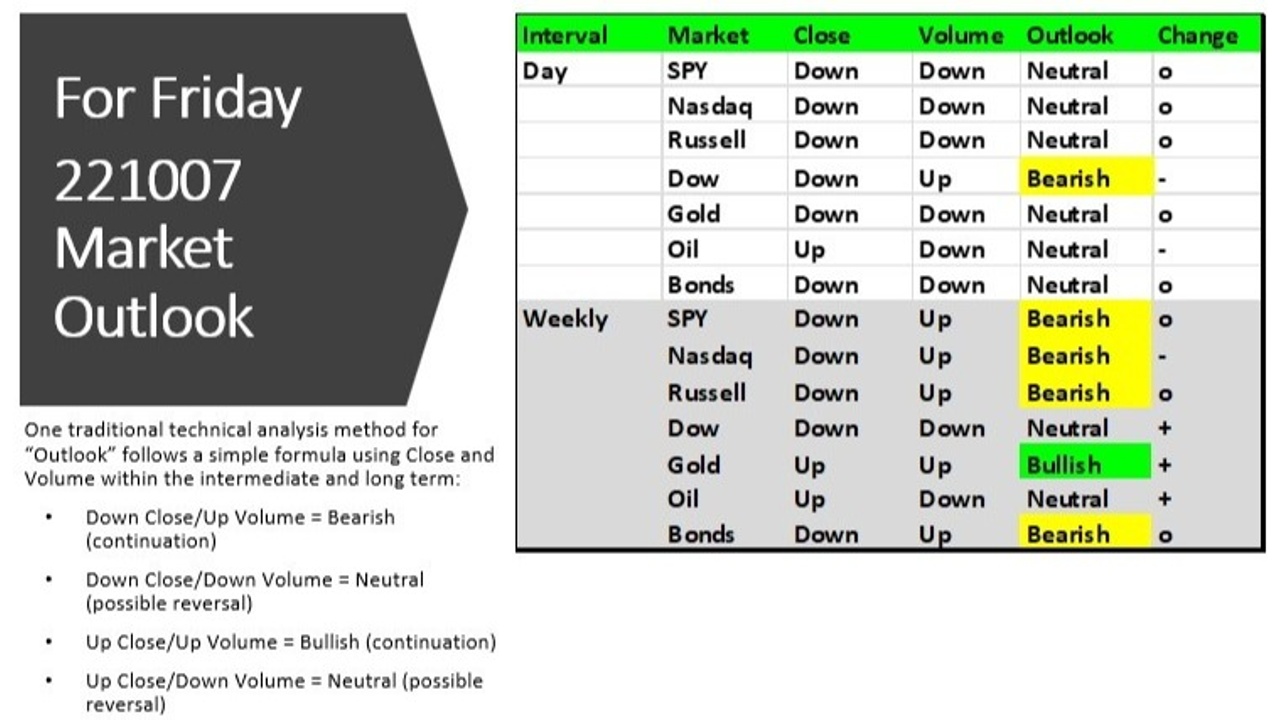
The Daily Market Forecast

Friday’s Best S&P Turning Points Results: The suggested buy @ 3654.00 ran for 26.50 points with only 2 ticks of adverse move.
Today’s Best S&P Turning Points (consider wider stops and less size in fast moving markets):
Short 3731.75 stop 3737.50. Buy 3516.50 stop 3511.75.
Quick Tip: Next up…
Looking on the chart above at how price is approaching the buy level you might feel like you were stepping in front of a freight train. The plunge was fast with no support to stall it.
This strategy, volume-at-price, has a history of turning with 2 ticks or less adverse move (like this one) 18% of the time. On the downside, the strategy stops out 32% of the time. That should take care of any fear to enter.
The winners will require open trade management skill to eke the most out the run, in this case a maximum of 26.50 points. Preset targets, chart features, measured moves, and trailing stops are some of the exit strategies you can use.
What you need to anticipate is the failed trade. Ar...
The Daily Market Forecast
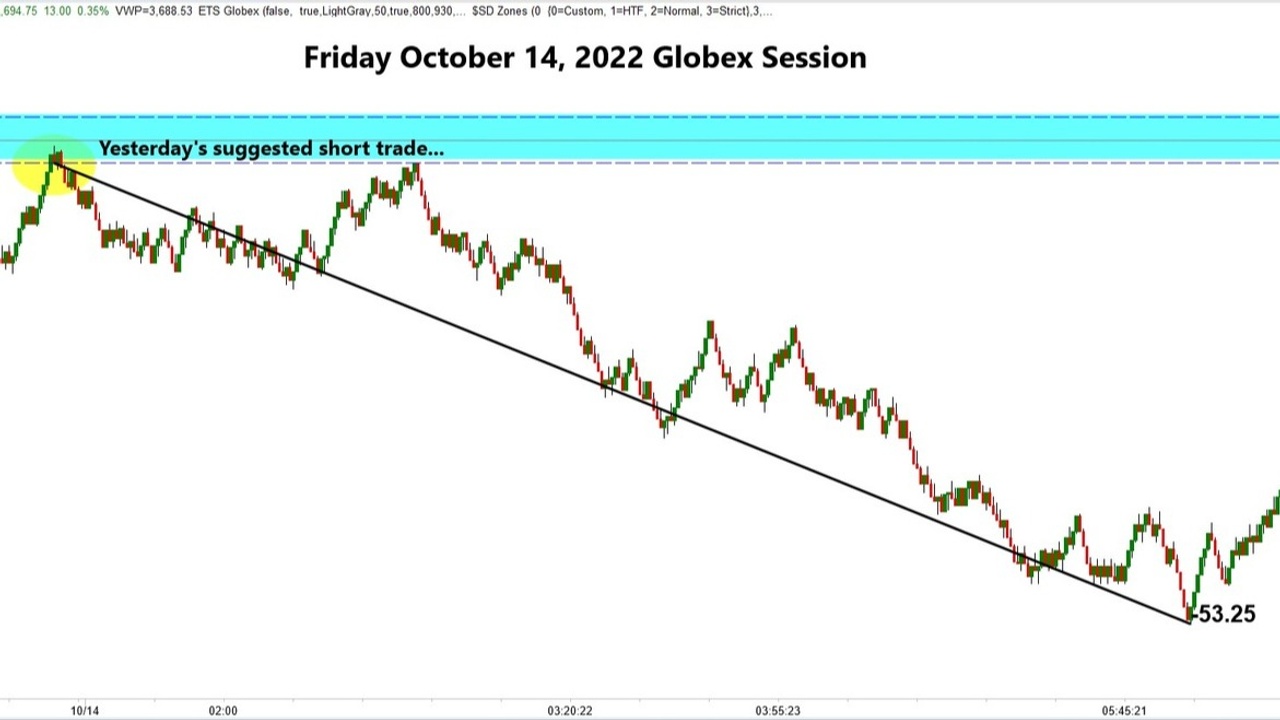
Thursday’s Best S&P Turning Points Results: The buy @ 3501.25 missed filling by only 1 point. The short @ 3713.50 filled in the Globex last night and ran for 53.25 points.
Today’s Best S&P Turning Points (consider wider stops and less size in fast moving markets):
Short 3778.00 stop 3783.00. Buy 3654.00 stop 3649.25.
Quick Tip: History Teaches…
Technical indicators can be helpful. The chief complaint is that most are lagging what’s happening in present time. “What good is history when we’re trying to determine what will happen next?”
It turns out history is an excellent teacher. Historical evidence doesn’t always work, but there are probabilities gleaned from its analysis. Trading is all about probabilities, not certainties. From this perspective they are valuable.
Used skillfully, knowing their benefits and limitations, technical indicators can help build your case for taking a trade or not.
Here’s an example: Think about trend. You’ve no doubt heard the advice “Trade in t...
The Daily Market Forecast
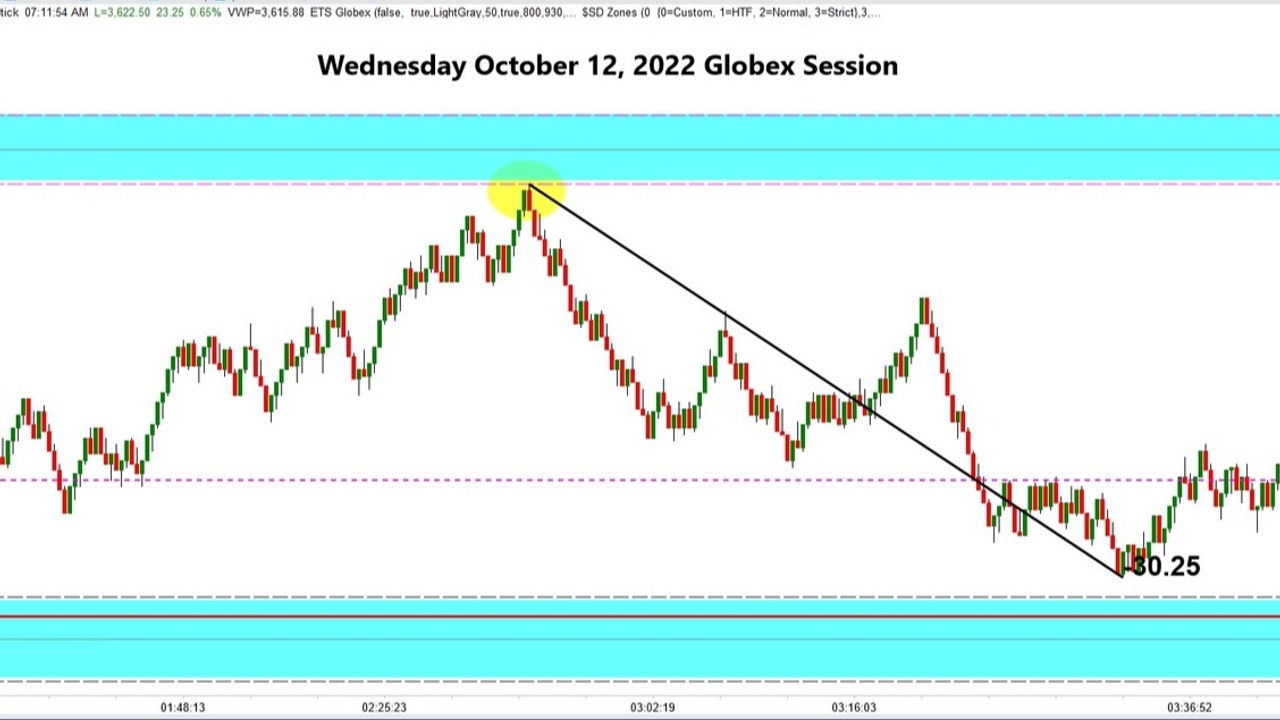
Wednesday’s Best S&P Turning Points Results: Neither suggested level triggered.
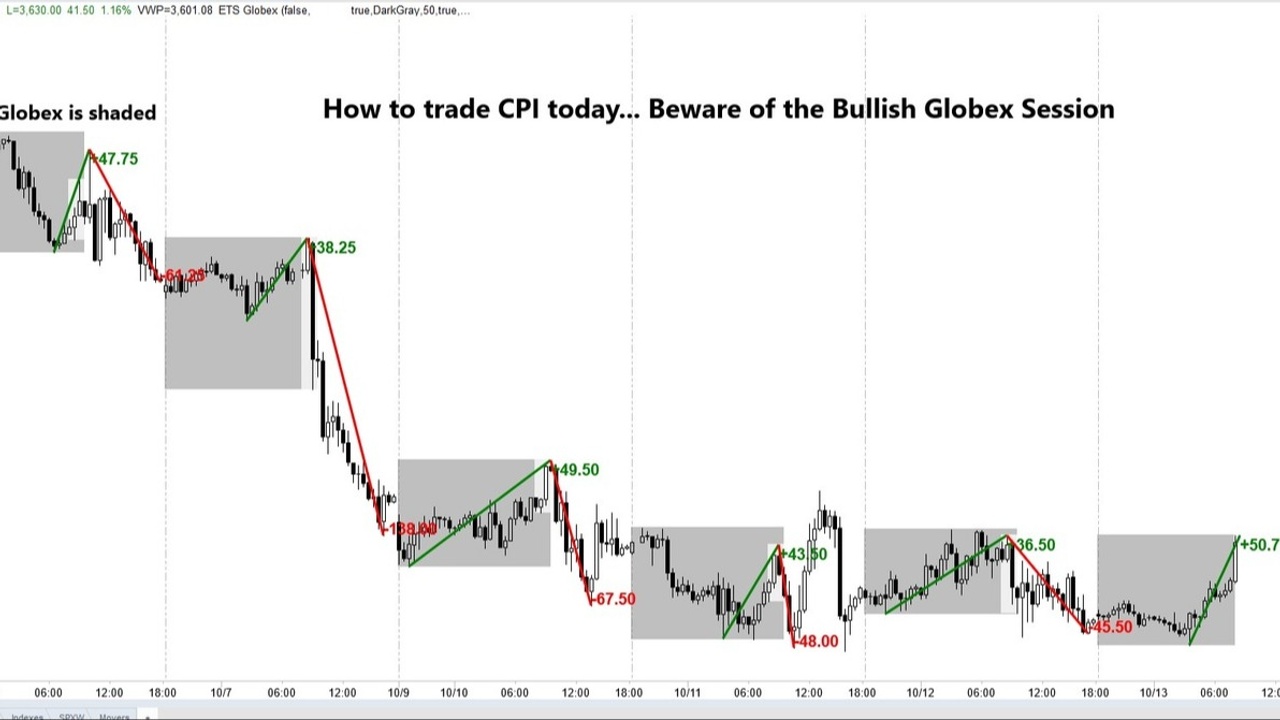
Quick Tip: How to Trade CPI
We’re in a Bear market. Inflation is high. Interest rates are rising. Recession is looming. You know all that and it’s not bullish.
There is a ton of money on the sidelines waiting to buy. They’re looking for a signal. Today’s CPI may be that signal. We could see a huge runup if the CPI number is favorable. If that happens you’ll see another Bear Market rally. The global economic conditions going forward do not suggest today’s possibly good CPI will signal a bottom has been formed.
The chart above shows the S&P Futures with the Globex session (overnight) shaded. Notice how every day in the past week buyers rallied the Globex and sold off the day session. Granted this is a small sample size to depend on but it is a trend. It’s repeating.
The volatility when CPI is released will soar. Spread will widen and it won’t be an easily tradable market. Better to wait for price act...
The Daily Market Forecast
Tuesday’s Best S&P Turning Points Results: Neither suggested level triggered.
Quick Tip: Futures Fills
Trading futures contracts on the Globex exchange (cmegroup.com) might be the fairest market in the world. Why? Because the orders are time-stamped upon arrival and filled on a first-in first-filled basis. No one gets preference. You’re in a line and it doesn’t matter if you’re a small retail trader or an institution.
Real-world example: Looking at the winning trade from the Globex last night (see chart above) you’ll notice that price turned right on the suggested buy level. Not even one tick adverse move. In fact, checking the volume at price there were 37 micros and 19 minis traded there. That’s worldwide!
Bottom line is you’re not guaranteed a fill. Maybe you were too far back “in the line” and price bid lower, not filling your order.
Granted, this is an extreme example but for this strategy it happens 7% of the time. Those are all winners you don’t want to miss.
One of t...
The Daily Market Forecast
Monday’s Best S&P Turning Points Results: Neither suggested level triggered.
Quick Tip: Which Market?
The word “market” can mean asset. Stock market. Oil market. Gold market.
It can also mean “condition.” Trending market. Ranging market.
Your strategy rules should be customized to a market condition. No strategy performs well in all market conditions.
It’s commonly said that markets trend around 30% of the time. That leaves 70% for range-bound conditions.
Trending markets offer larger profit opportunities. When you catch a trend it can persist for quite some time. However, you’ll have more losing trades when whipsaws occur.
Range-bound markets offer more winning opportunities. As price moves back and forth from support to resistance you can capture more but smaller winning trades.
Which do you prefer? This is important because your trading style needs to resonate with your personality. You should like it. It should be play not work.
The best way I’ve discovered to fin...
The Daily Market Forecast
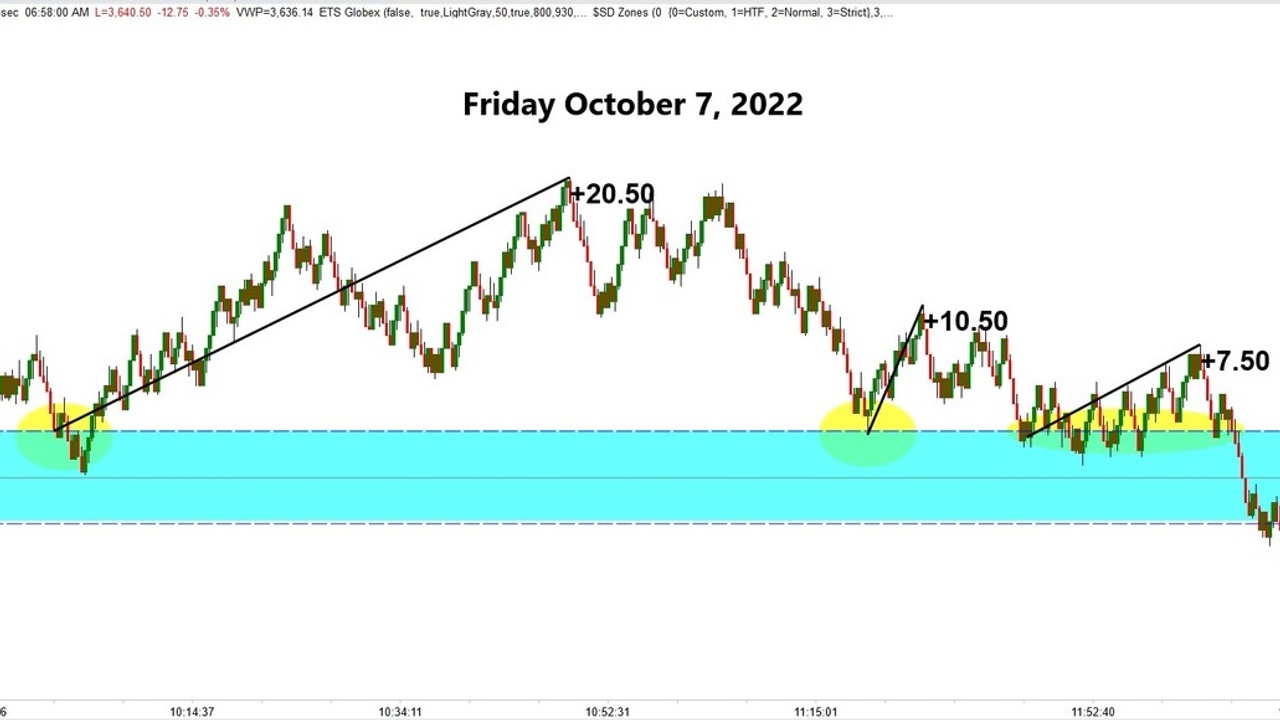
Friday’s Best S&P Turning Points Results: Price opened below the first buy level. The second idea @ 3674.25 was good for a 20.50-point run.
Quick Tip: Second Helpings
The charts you see here are based on our proprietary version of volume-at-price. The levels are legacy high volume price ranges. They stay on the chart until violated so some of them are quite old. They still work though.
A great question would be how many entries are you willing to take on the same level? Notice the first touch ran for 20.50 points. The second touch 10.50 points. The third touch 7.50 points. This is an example that shows how orders fill and then they’re gone. No question this price range had plenty of buy orders… for a while.
Historically, the first touch is best and subsequent touches are lower probability. If you’re aggressive and want to enter those subsequent touches, consider reducing your profit target expectations. Or at least scale out more of the position earlier than you would on the in...
The Daily Market Forecast
Thursday’s Best S&P Turning Points Results: The suggested short @ 3790.50 was only good for a 4-point scalp before stopping out.
Quick Tip: Daily Risk
Successful traders manage risk in many ways. The obvious stop loss order is only the beginning of a full-blown risk management plan. Daily risk is part of the plan.
For example, other than the trading floors at institutions with household names, there are plenty of Proprietary Trading businesses. These are privately owned. They hire, train, and finance traders who work for a percentage of the profit.
Consider this: they are betting on inexperienced traders to become profitable in a reasonable amount of time, trading with their capital. Whoa!
How important would risk management be to you if you owned the business? Number 1, for sure.
The Risk Manager can monitor every trader in real time with a dashboard of information showing results. When any trader, new or seasoned, hits their daily loss limit they are pulled from live tradin...
The Daily Market Forecast
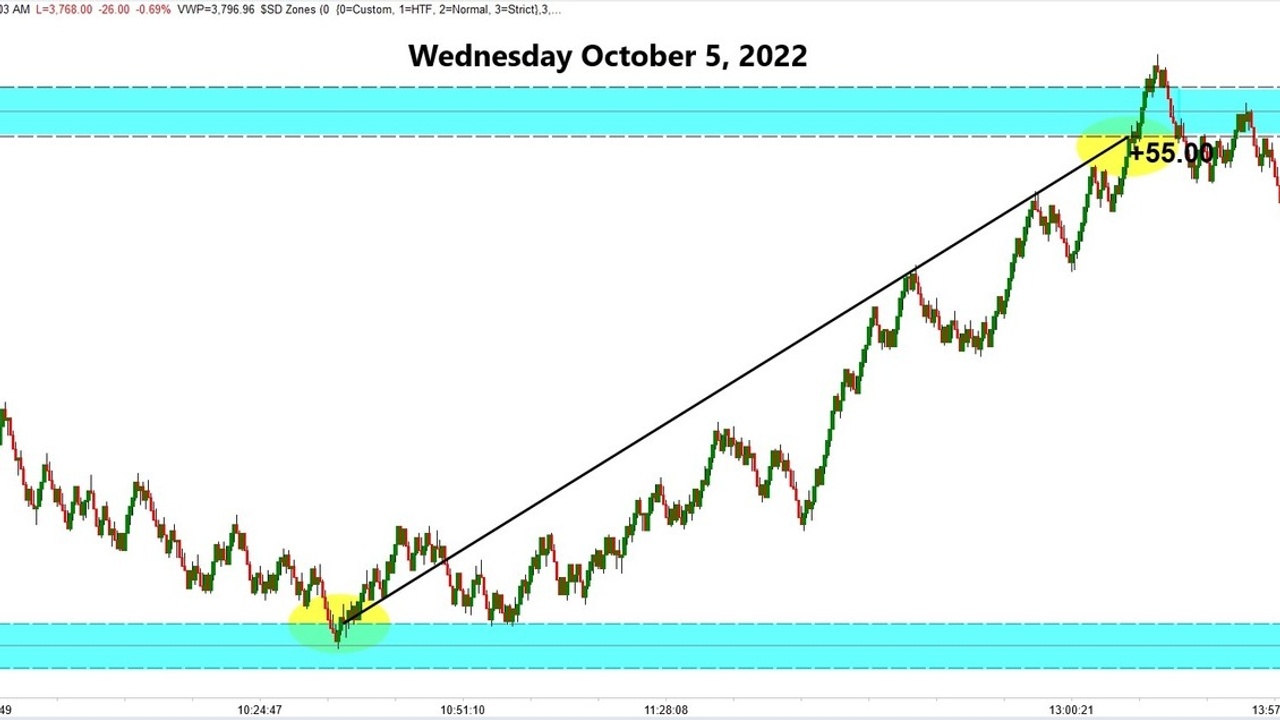
Wednesday’s Best S&P Turning Points Results: Shorting Buying 3736.75 delivered 55 points to the suggested short @ 3791.75 which stopped out.
Quick Tip: Banking it…
How traders approach their craft is very individual. Three traders using the same strategy may have different beliefs that vary their results, yet they follow the same entry and exit rules.
For example, yesterday’s buy at 3736.75 soared to the suggested short at 3791.75 for a 55-point gain. That’s a big win for a day trader. Would you bank your day or keep trading? This decision has nothing to do with the strategy rules. It’s personal money and time management.
One trader banks the day to research other strategies.
Another trader works the entire day, taking all setups and gives back half the gain.
Another trader banks the day, turns to simulated mode and trades the remaining day for practice.
This type of decision and others like it are part of their trading plans. Their individual approaches to the same win...
The Daily Market Forecast
Tuesday’s Best S&P Turning Points Results: Shorting 3777.50 stopped out.
Quick Tip: Futures Rule
If you’re know all the benefits of trading the Futures markets skip to the World Sentiment Index below. If you do not, this will be an eye-opener for you.
Here are the 5 key benefits of trading Futures:
1. Accessibility: Markets are open 23 hours/day from 6PM ET on Sunday to 5PM ET on Friday
2. Diversity: Trade stock indexes worldwide, popular cryptocurrencies, currencies, interest rates, metals, energies, agricultural, meats, and “softs” (think cotton).
3. Minimal Capital Required: With the release of smaller (Micro) contract sizes it is now possible for a retail trader to get started with $5000 assuming good risk management.
4. Superior Leverage: Depending on the contract, several times better than the stock market.
5. Tax Break: Futures gains are taxed differently and always less than other markets.
Curious to know more? Click here to read the entire white paper “Why Tra...
The Daily Market Forecast
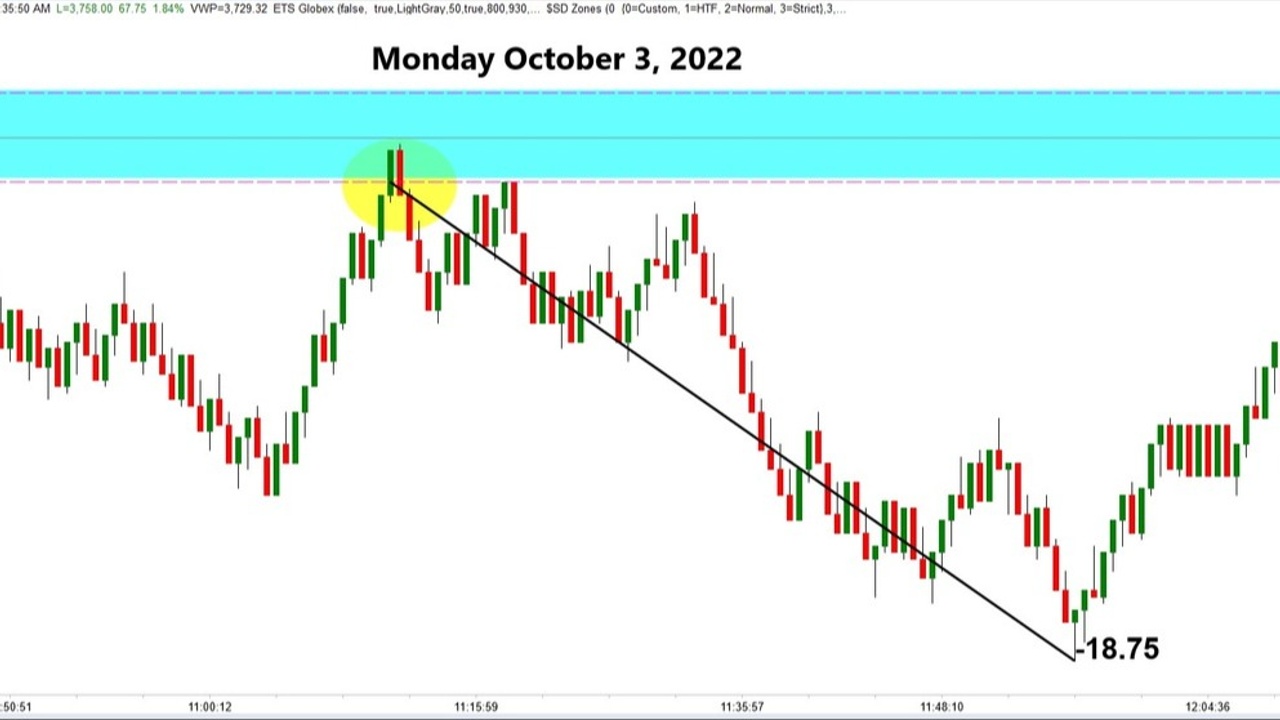
Monday’s Best S&P Turning Points Results: Shorting 3678.50 ran for 18.75 points.
Quick Tip: Goals & Style
If you were building your trade plan and your mentor told you to determine your trading style and set goals, what might they be?
Money probably came to mind first. Not a good goal, though. Money is a byproduct of skilled trading. Your goals should pertain to your development in becoming an expert trader. Style selection, trading platform usage, order entries and exits, research, documentation, review, all require practice and skill.
One clever way to determine your goals (for anything) is to make a list of what you DON’T want to do.
For example, there are so many ways to trade the markets and not every style or niche is going to resonate with you. Instead of trying to figure out what your preference is, start by listing what you know is not.
You may have no interest in reading public company SEC filings, buying stocks, and holding them for years. Another trader may have ...